TellUs data catalogue
Browse all topics, narrow the list to a topic, or search by name, asset ID, or folder. Results show at most 12 entries per page; expand Dataset details for paths, sources, and time coverage.
Use the displayed ID in a quick-topic link or an assistant request. Overlays belong on compatible Earth maps. To add or remove datasets, see Asset library.
196 indexed entries · 180 previews · snapshot 2026-10-07
Showing 1–12 of 196 entries
100 brightest satellites
satellites_100_brightestDataset details
- Topic
- Space & satellites
- Descriptor
earth/space/satellites/100_brightest/asset.json- Author / curator
- TellUs
- Source
- Not provided in metadata
- Time coverage
- Not provided in metadata
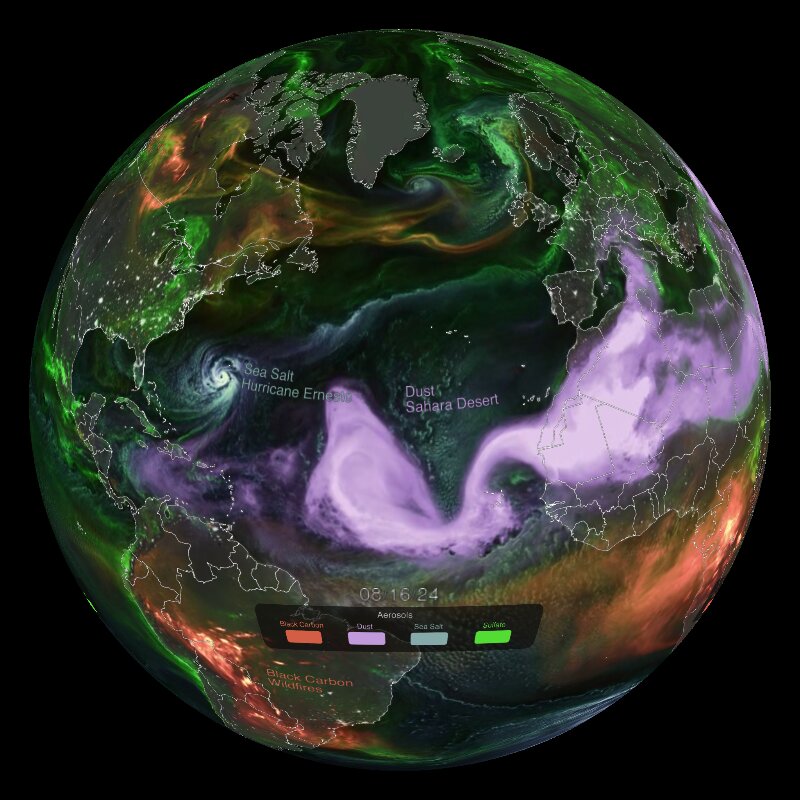
aerosols in the air
aerosolsDataset details
- Topic
- Atmosphere
- Descriptor
earth/atmosphere/aerosol/asset.json- Author / curator
- NOAA SoS
- Source
- GEOS-FP 2km, NASA Global Modeling and Assimilation Office (GMAO)
- Time coverage
- august 1 - september 14, 2024
- Visual / legend
- anim: Earth globe with colored particle flows. Blue spirals=sea salt from hurricane, pink/magenta=Saharan dust, orange/red=black carbon from wildfires, green=sulfate aerosols. Shows atmospheric connections across continents.
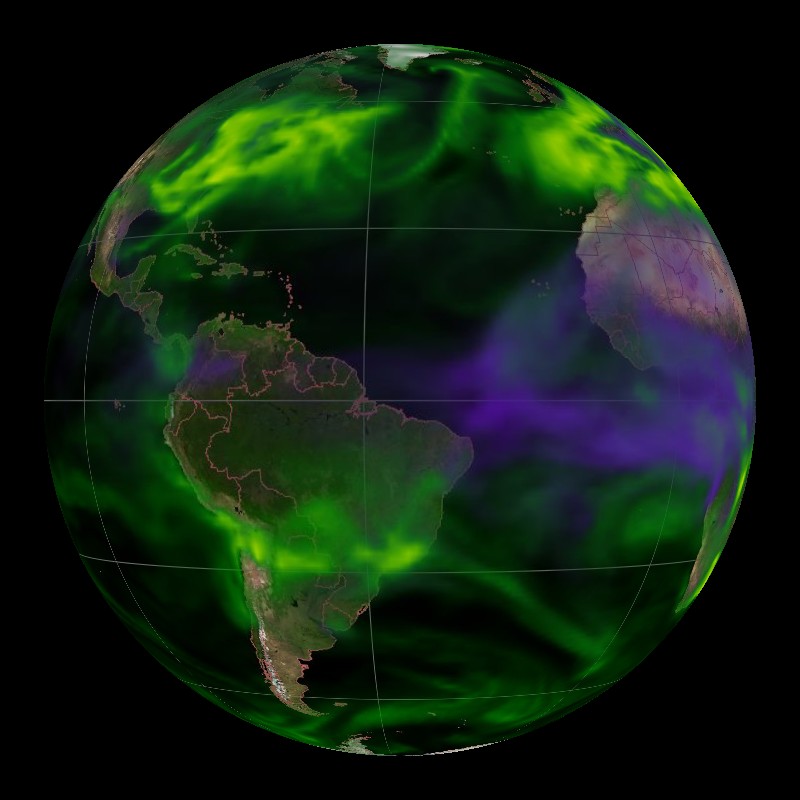
aerosols: black carbon and sulfate
aerosols_blackcarbon_sulfateDataset details
- Topic
- Atmosphere
- Descriptor
earth/atmosphere/aerosol/blackcarbon_sulfate/asset.json- Author / curator
- NOAA SoS
- Source
- NASA Global Modeling and Assimilation Office
- Time coverage
- january 31, 2007 to february 4, 2007
- Visual / legend
- background: tan/brown continents, black ocean with grid. anim: gradient: black carbon and sulfate optical thickness. green (sulfate)=0.01-1.0, purple/magenta (black carbon)=0.002-0.2. high concentrations visible over Asia and Northern Hemisphere
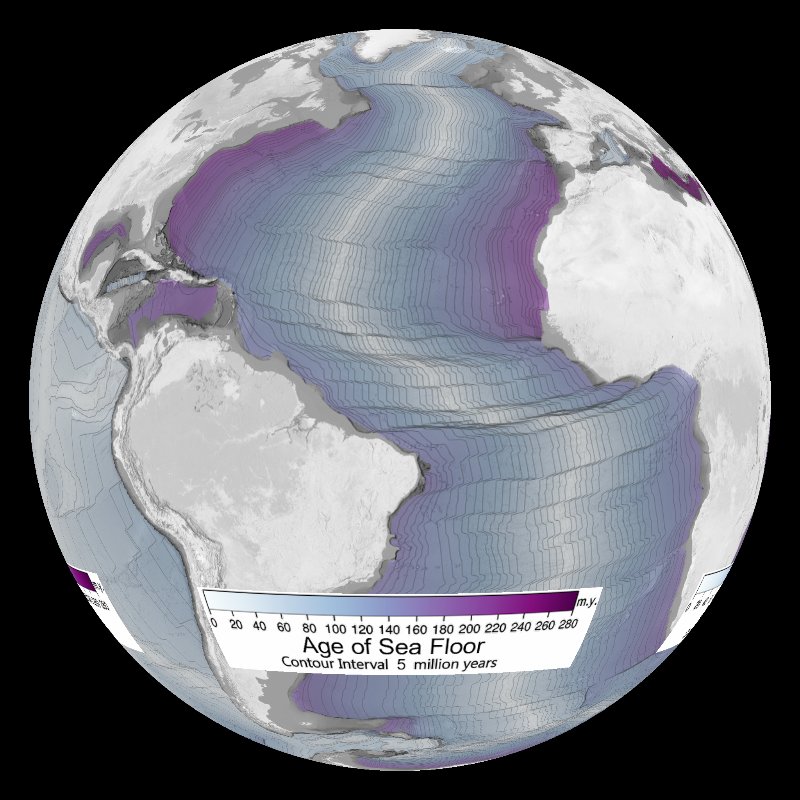
age of the seafloor
sea_floor_ageDataset details
- Topic
- Oceans
- Descriptor
earth/oceans/sea_floor_age/asset.json- Author / curator
- NOAA SoS
- Source
- NOAA National Centers for Environmental Information (NCEI). Data from four companion digital models by C. Gaina, M. Sdrolias, W.R. Roest, and R. Dietmar Muller (University of Sydney).
- Time coverage
- 2008
- Visual / legend
- gradient: age of the sea floor in million years. white=0, blue=140, purple=280. contour lines: 5 million year interval
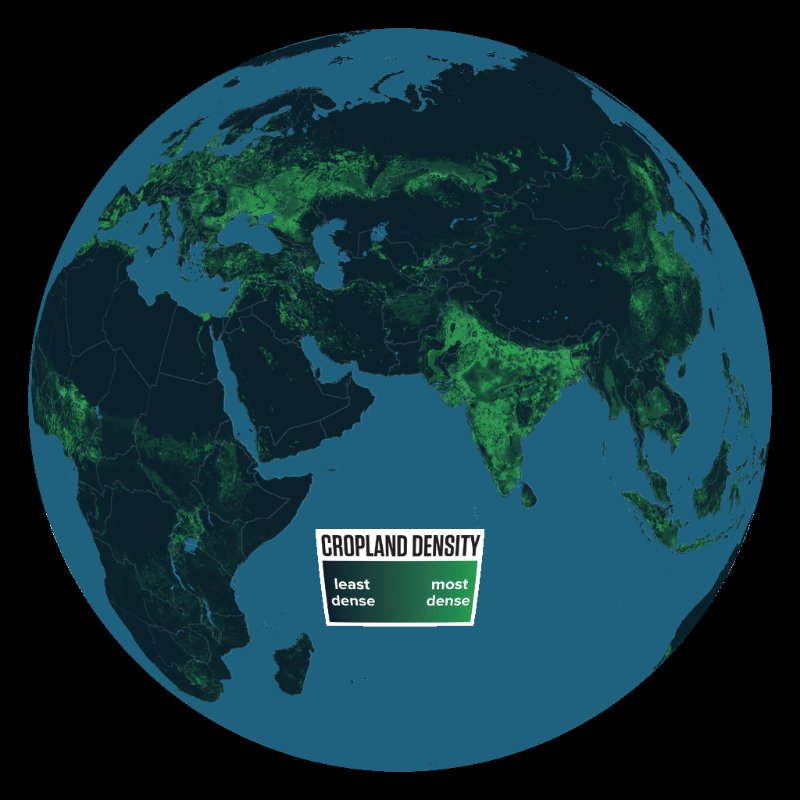
agriculture: cropland intensity
agriculture_croplandDataset details
- Topic
- Human activity
- Descriptor
earth/human_activity/agriculture/cropland/asset.json- Author / curator
- NOAA SoS
- Source
- University of Minnesota/Institute on the Environment/Global Landscapes Initiative
- Time coverage
- unknown (pre-2012)
- Visual / legend
- gradient: cropland intensity. dark blue=no cropland, bright green=highest density
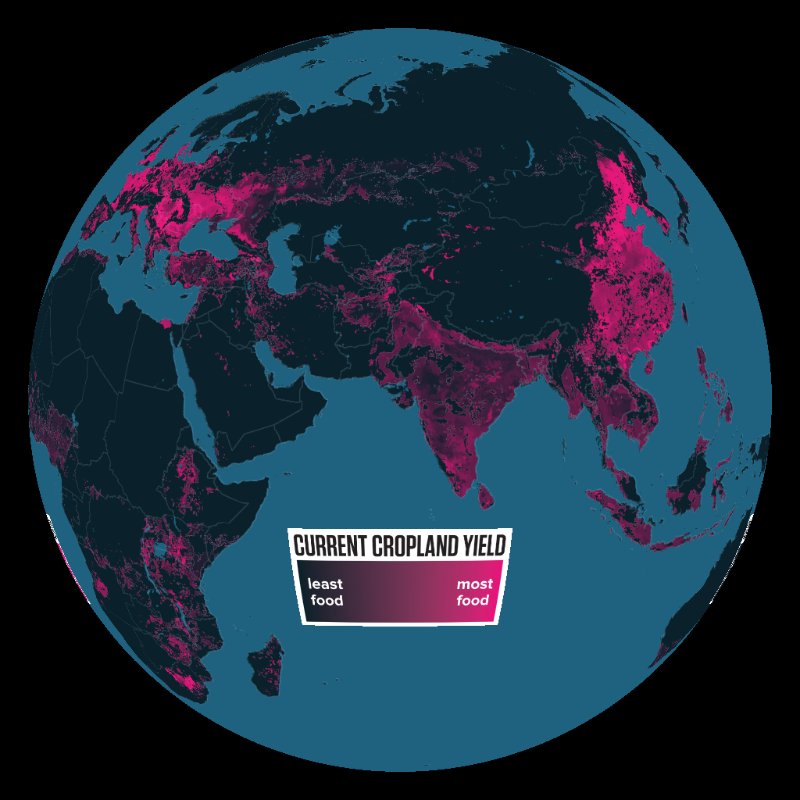
agriculture: cropland yield (current)
agriculture_yieldDataset details
- Topic
- Human activity
- Descriptor
earth/human_activity/agriculture/yield/asset.json- Author / curator
- NOAA SoS
- Source
- University of Minnesota/Institute on the Environment/Global Landscapes Initiative
- Time coverage
- unknown (pre-2012)
- Visual / legend
- gradient: cropland yield (tons/hectare). dark blue=lowest, pink/magenta=highest. corn, wheat, rice
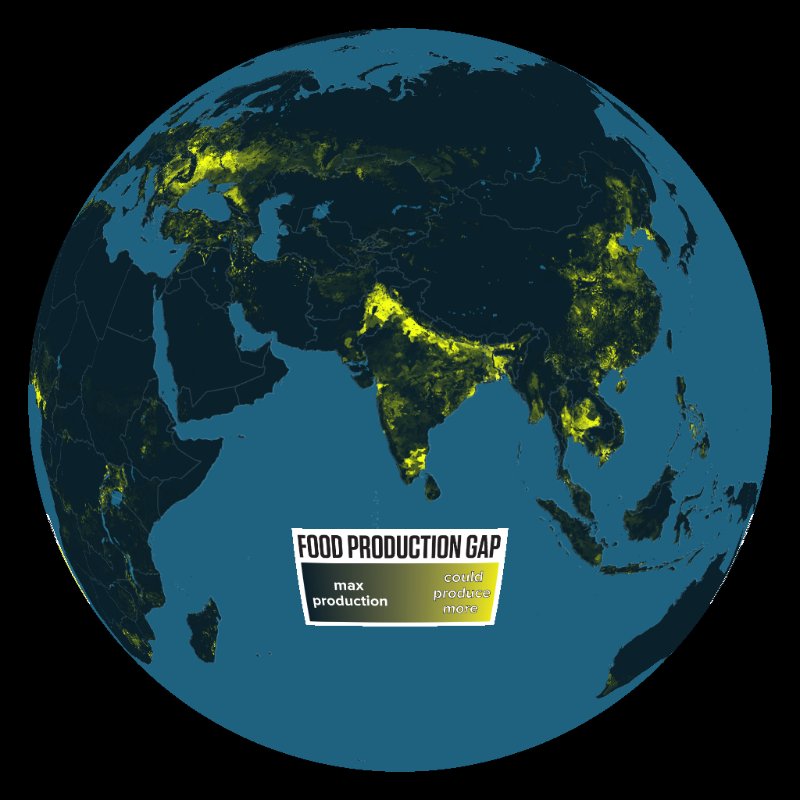
agriculture: cropland yield (gap)
agriculture_yield_gapDataset details
- Topic
- Human activity
- Descriptor
earth/human_activity/agriculture/yield/gap/asset.json- Author / curator
- NOAA SoS
- Source
- University of Minnesota/Institute on the Environment/Global Landscapes Initiative
- Time coverage
- unknown (pre-2012)
- Visual / legend
- gradient: production gap. dark blue=maxed production, yellow=high potential. corn, wheat, rice
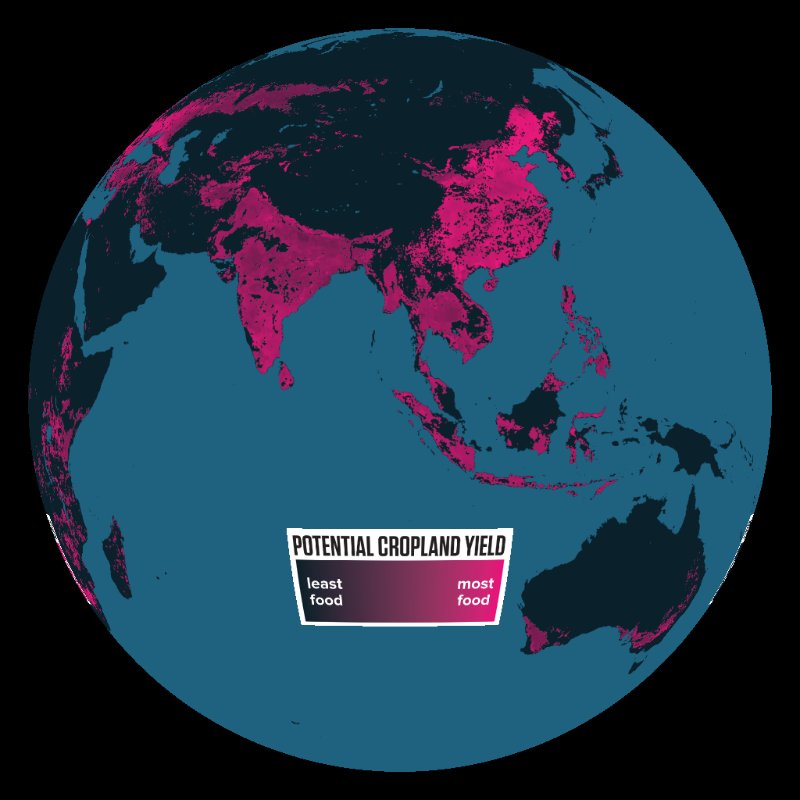
agriculture: cropland yield (potential)
agriculture_yield_potentialDataset details
- Topic
- Human activity
- Descriptor
earth/human_activity/agriculture/yield/potential/asset.json- Author / curator
- NOAA SoS
- Source
- University of Minnesota/Institute on the Environment/Global Landscapes Initiative
- Time coverage
- unknown (pre-2012)
- Visual / legend
- gradient: potential cropland yield (tons/hectare). dark blue=lowest potential, pink/magenta=highest. corn, wheat, rice
agriculture: food vs. feed
agriculture_food_vs_feedDataset details
- Topic
- Human activity
- Descriptor
earth/human_activity/agriculture/food_vs_feed/asset.json- Author / curator
- NOAA SoS
- Source
- University of Minnesota/Institute on the Environment/Global Landscapes Initiative
- Time coverage
- unknown (pre-2012)
- Visual / legend
- gradient: crop use. green=human food, orange=equal human/livestock feed, red=livestock feed
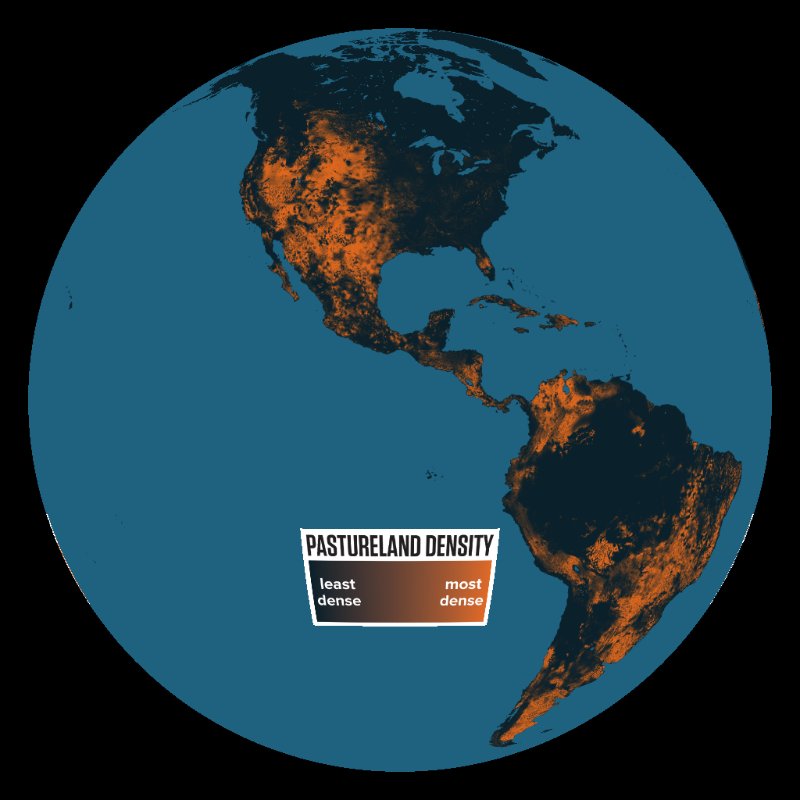
agriculture: pastureland intensity
agriculture_pasturelandDataset details
- Topic
- Human activity
- Descriptor
earth/human_activity/agriculture/pastureland/asset.json- Author / curator
- NOAA SoS
- Source
- University of Minnesota/Institute on the Environment/Global Landscapes Initiative
- Time coverage
- unknown (pre-2012)
- Visual / legend
- gradient: pastureland intensity. dark blue=no pastureland, orange/brown=highest density
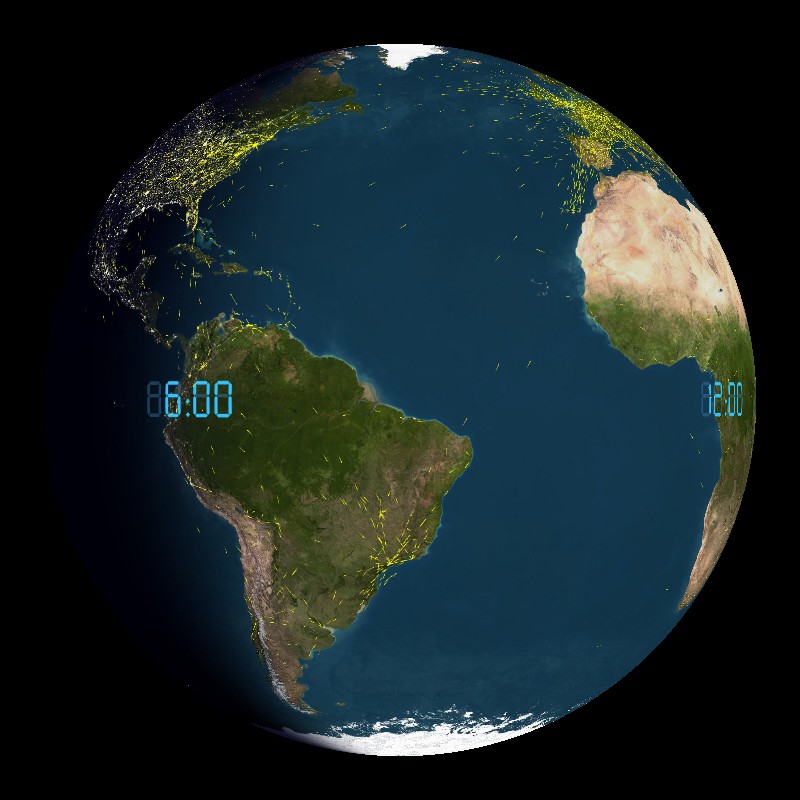
air traffic
air_trafficDataset details
- Topic
- Human activity
- Descriptor
earth/human_activity/air_traffic/asset.json- Author / curator
- NOAA SoS
- Source
- flightstats.com
- Time coverage
- unknown (real-time 24-hour cycle)
- Visual / legend
- anim: commercial flight tracks. yellow tails=individual aircraft. day/night terminator shown. day traffic concentrated over North America, Europe, Asia
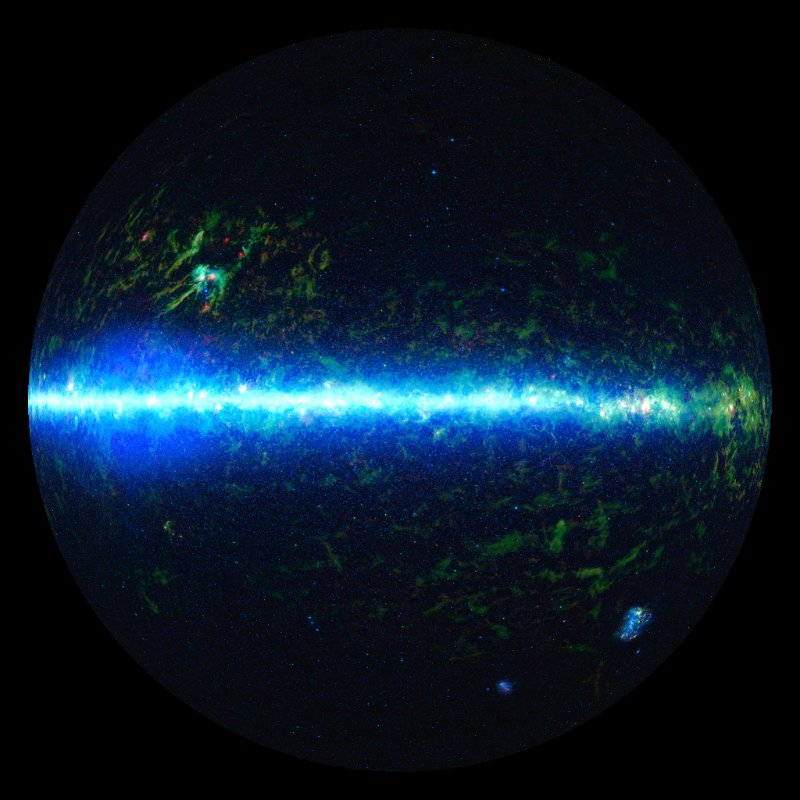
all sky wide-field infrared survey explorer mosaic image
allsky_wiseDataset details
- Topic
- Space & satellites
- Descriptor
space/allsky_wise/asset.json- Author / curator
- NOAA SoS
- Source
- NASA/JPL-Caltech/WISE Team
- Time coverage
- 2010-2012
- Visual / legend
- image: all-sky infrared survey (3.4, 12, 22 microns). cyan/blue=stars/galaxies, green/red=dust
Library note: shared asset IDs
This snapshot has 196 entries but 195 unique IDs. Shared IDs: sun. Their cards show separate descriptor paths. Assign unique IDs in the library before relying on unambiguous app selection.
About this catalogue
This is a snapshot of tellus-data/index.json and its asset.json descriptors. Previews are included in the docs, so you can browse without running the asset server. Entries without a thumbnail remain listed.
Source/date information comes from the descriptors and may be incomplete. Shared asset IDs are flagged in the details and library note; assign unique IDs for unambiguous app selection.